


“Learn a trade. Work with your hands. Robots are decades away.”
That reassurance has been repeated to workers watching software AI reshape office work. It sounds plausible: code and documents are easier to automate than a truck cab, a warehouse aisle or a construction site.
A working paper posted October 16, 2026, offers a new way to test that assumption. Its map does not predict that workers will be replaced. But it does challenge the idea that physical jobs are safely beyond automation’s reach.
A Robotics Map Finds The Other Side Of AI Exposure
In “How exposed is work to robotics? Occupational, industry, and geographic measures”, Sebastian Sartor of MIT, Robert Seamans of NYU and Neil Thompson of MIT FutureTech build an abilities-based measure of potential exposure to robotics and physical AI.
The authors compiled 16 robotics capabilities across eight domains from 78 academic, industry and standards sources. They used a large language model to assess how each capability relates to 52 O*NET work abilities, then aggregated the scores into measures for 774 occupations, 250 industries and U.S. counties.
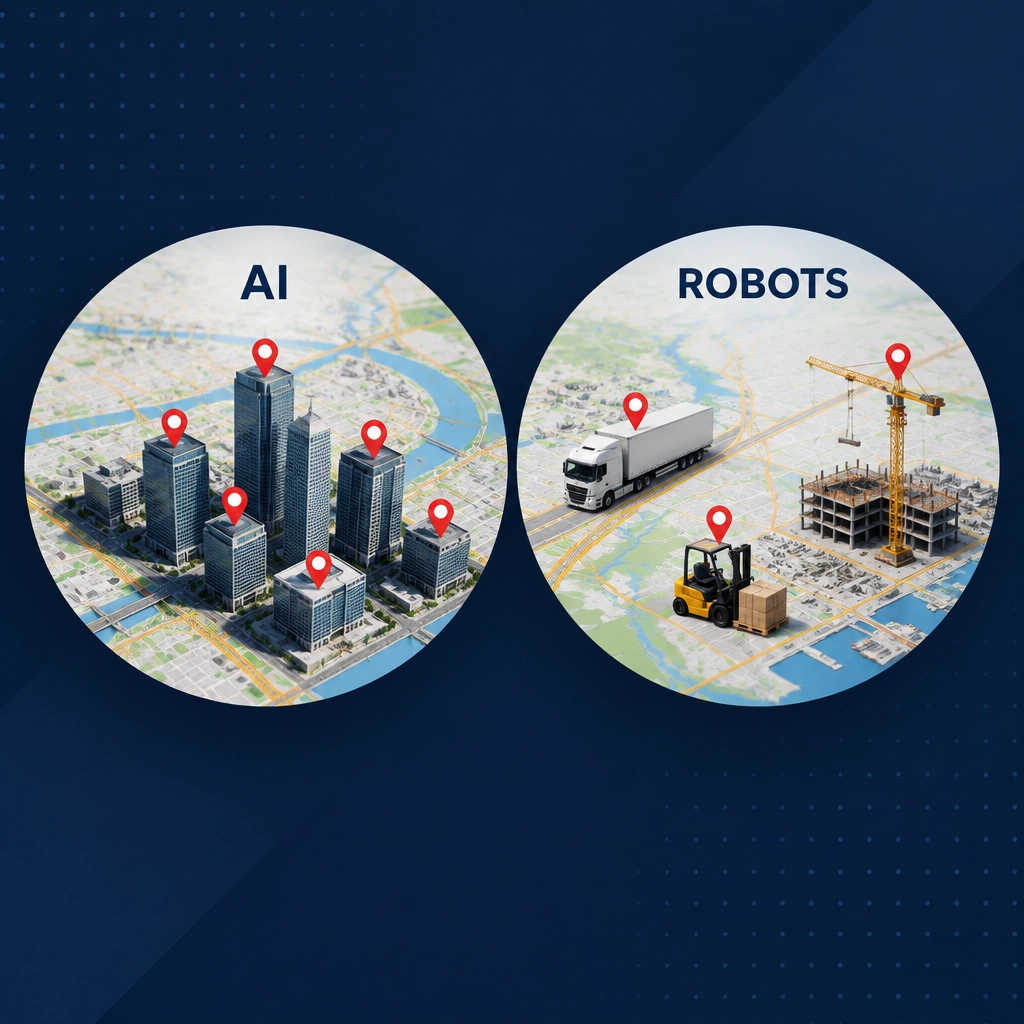
The striking result is the inversion. Across 22 job families, robotics exposure and generative-AI exposure rank almost opposite to one another: their Spearman correlation is -0.93. Construction and extraction ranks highest in robotics exposure and lowest in AI exposure. Computer and mathematical occupations sit at the other end.
Transportation and material moving scores +1.01 on robotics exposure and -0.73 on AI exposure. Production scores +0.98 and -0.80. Office and administrative support shows the reverse pattern: -0.69 for robotics and +0.69 for AI. Management scores -0.92 for robotics and +1.01 for AI.
The message is not that AI has stopped affecting office workers, or that robots are about to take every physical job. It is that “safe from AI” depends on which kind of AI you mean.
The Jobs And Industries On The Map
Pile-driver operators rank first among the most robotics-exposed occupations. Sewing-machine operators and hand sewers follow, then logging equipment operators and garment pressers. Industrial truck and tractor operators rank next; heavy and tractor-trailer truck drivers are seventh. Construction-equipment operators and bus drivers also appear among the top twenty.
At the industry level, logging ranks first, followed by truck transportation, coal mining, urban transit systems and charter bus services. The high-exposure group also includes support activities for crop production, highway and bridge construction, couriers and express delivery, waste collection, and warehousing and storage. Legal services ranks lowest among the 250 industries.
The patterns are not limited to a particular machine or task. The paper finds exposure linked to physical work such as moving, handling and navigating environments. It also reports clear gradients: average robotics exposure falls from +0.23 in the lowest-wage bin to -0.65 in the highest. By education, it declines from +0.85 in the lowest-education bin to -1.22 in the highest. Creative-ability weight separates occupations most sharply, from +1.29 in the least-creative bin to -1.07 in the most-creative. Exposure is also higher in occupations with fewer women, from +1.11 in the lowest female-share bin to -0.48 in the highest.
These are averages across measured categories, not conclusions about any individual worker’s prospects. But they make the old advice (your hands are your moat) harder to accept without qualification.
Where Robotics Exposure Is Concentrated
The geographic analysis looks at employment in high-exposure industries. Across the country, 18% of U.S. workers are in those industries, compared with 43% in high generative-AI-exposure industries.
The share varies by state: 7% in Washington, D.C., 12% in New York, 23% in Indiana, 24% in Kentucky, 28% in North Dakota and 31% in Wyoming. The authors caution that these figures describe employment in industries categorized as high exposure; they do not mean that the same share of jobs in a state will be automated. A county or state score is a map of where relevant work is concentrated, not a forecast of local layoffs.
For workers in trucking, manufacturing, IT or related fields, the practical point is not to relocate based on a ranking. It is to recognize that exposure is not distributed evenly, and that a national headline may conceal very different local economies.
Read The Map As A Ranking, Not A Countdown
The authors are explicit: these measures capture technical relatedness, not current readiness, cost or adoption. They describe the indices as an upper bound on where physical automation could affect work, not as a forecast of displacement. The scores are best used to compare relative exposure, not treated as absolute probabilities.
That distinction matters. Hardware is only part of the cost. Deployment and integration take time, and systems require people with the skills to program, maintain and manage them. The paper also notes how unevenly AI has been adopted: it cites research estimating that models can complete about half of LLM-accessible tasks at least at average human quality, with frontier models reaching roughly 70% success in 2025’s third quarter versus 60% for pooled models. Another study it cites found AI deeply integrated in only 11% of S&P 500 firms.
The paper is a working paper, not peer reviewed. Its exposure index also does not tell us whether robotics will substitute for workers or complement them. A robot may change the tasks in a job, support a worker, or make a different operating model possible. Exposure can mean that work changes, not that people vanish.
So there is no reason to panic. There is reason to pay attention. The map says physical work is a second front in the automation conversation, even if the pace and consequences remain uncertain.
Ownership Changes The Question, Not The Risk
For someone whose job feels less secure, business ownership can be worth exploring. But owning a business does not put you outside the economy or beyond technology’s reach. It changes the questions you need to answer.
A franchise owner still faces startup capital needs and possible debt, local customer demand, hiring and retention, daily execution, royalties and other fees, franchisor rules, territory terms, and technology subscriptions or required upgrades. Automation could affect a brand’s staffing model, costs, customer experience and competition.
Before pursuing a franchise for sale, ask how the franchisor expects its own operations, and its franchisees’, to change as physical AI advances. Then investigate whether the business model, investment and responsibilities fit your financial position, local market, skills and risk tolerance. The best franchises to own are not universal winners; they are opportunities that withstand careful scrutiny against your own criteria.
How To Buy A Franchise With Evidence
Start with the FTC’s Consumer Guide to Buying a Franchise and its Franchise Rule Compliance Guide. Read the Franchise Disclosure Document (FDD) carefully. In general, you must receive it at least 14 calendar days before signing a franchise agreement or paying the franchisor or an affiliate.
Pay close attention to:
- Items 5–7: Initial fees and estimated investment. Check what is included, what is not, and how much working capital your plan requires.
- Item 11: Training, support and required computer systems. Ask about AI tools, software subscriptions, hardware, updates and required upgrades.
- Item 12: Territory terms and restrictions, including how online sales and customers in your area are handled.
- Item 19: Any financial performance representations, and their limits. Not every franchisor provides them; examples are not a promise of your results.
- Items 20–21: Outlet history and franchisor financial statements. Speak with current and former franchisees to learn about costs, staffing, support and technology in actual operations.
Have an independent franchise attorney and financial professional review the documents and your assumptions. You can also consult the SBA Franchise Directory when assessing SBA financing eligibility. Inclusion in the directory is not an endorsement or approval of a brand and does not ensure success.
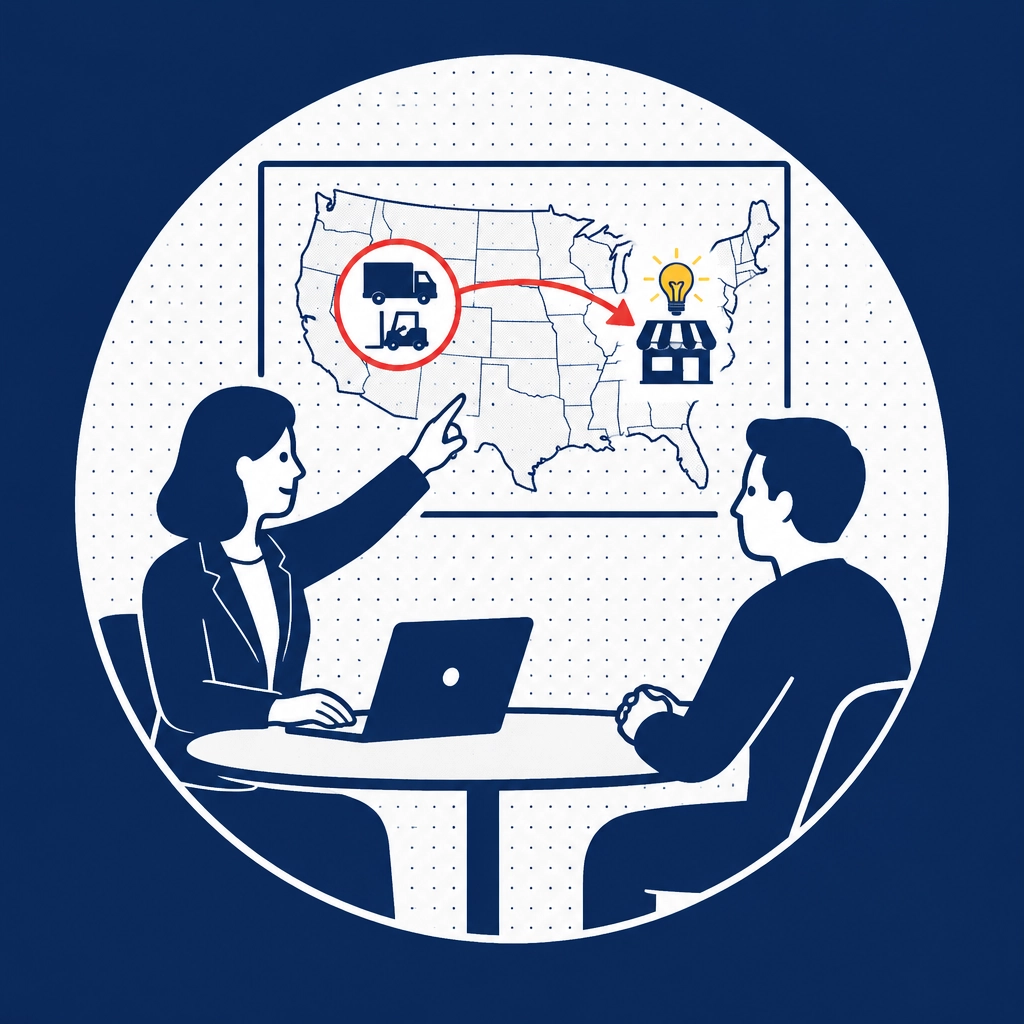
A franchise consultant can help you compare franchise opportunities and decide which questions to investigate first. A consultant does not replace independent review, professional advice or conversations with franchisees.
Start A Conversation With FranLift
If you are weighing a career change against ownership, you do not have to decide based on a headline or a ranking. A franchise consultant does not skip the homework; it helps you decide which homework is worth doing.
FranLift helps prospective buyers clarify goals and budget, research options and identify brands to investigate. Our buyer services are free because franchise companies cover the cost as part of their marketing budgets. Learn why FranLift works with buyers or start a conversation.

THERE IS NO GUARANTEED INCOME. Past results, where disclosed, do not guarantee future performance.
This article is for informational purposes only and is not financial or legal advice. Consult qualified independent professionals before making financial or legal decisions.
© 2026 FranLift. Launch Beyond Boundaries.
